
Ever wondered what the Earth's surface looks like without all the stuff on top of it? Imagine stripping away every single tree, building, and powerline, leaving just the bare ground. That’s exactly what a Digital Elevation Model (DEM) gives you—a 3D digital map of the planet’s raw topography.
It’s like a super-detailed contour map, but instead of lines, it’s a grid where every single pixel has a specific elevation value.
Decoding the Digital Landscape
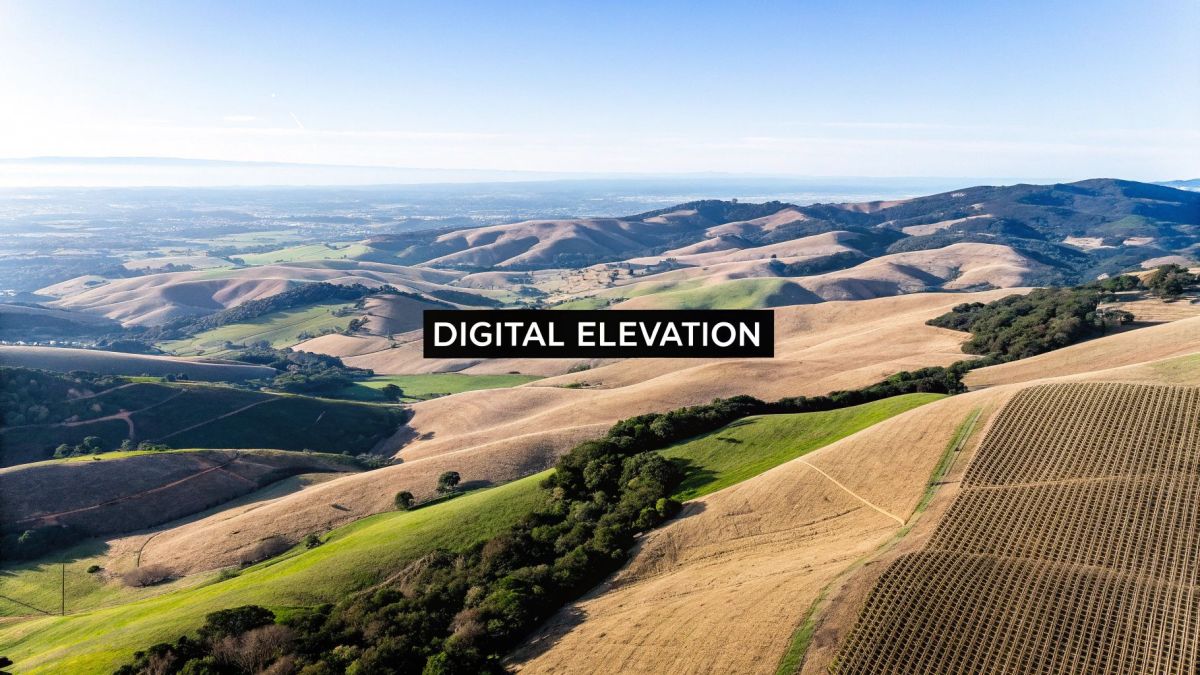
At its heart, a DEM answers one fundamental question for any point on the map: "How high is this spot?" This makes it a foundational dataset in geospatial science. It's the essential base layer for everything from the terrain view in Google Earth to complex environmental modelling.
A normal photo or a flat map only shows you two dimensions. A DEM adds the all-important Z-axis—height. This extra dimension lets us truly see and analyse the shape of the land, revealing slopes, valleys, and ridges with mathematical accuracy. It’s not just a picture; it’s a structured grid of pure elevation data.
The Foundation of Modern Mapping
These models really are the backbone of modern mapping and Geographic Information Systems (GIS). They are built using advanced technologies like satellites and LiDAR, which capture immense amounts of elevation data to create a powerful tool that helps us understand our world in incredible detail.
For instance, government agencies create large-scale DEMs for national resource management. A great example is Geoscience Australia's work on the 1-second SRTM DEM, derived from NASA's Shuttle Radar Topography Mission data gathered way back in 2000. This dataset gives us a consistent elevation model for all of Australia at about a 30-metre resolution.
A Digital Elevation Model is essentially a digital file of the bare-earth terrain. By removing all-natural and man-made features, it provides a clean and unobstructed view of the ground's true shape.
This base layer of "bare earth" is vital for a huge range of specialised jobs, including:
- Hydrological Modelling: Figuring out how water will flow across a landscape is key to identifying areas at risk of flooding.
- Infrastructure Planning: Planners can analyse terrain steepness to find the best routes for new roads, railways, and pipelines.
- Environmental Analysis: Researchers use it to study soil erosion, assess landslide risks, and track changes in landforms over time.
By offering a crystal-clear view of the Earth's surface, a DEM provides professionals with the fundamental data they need to make smart, accurate decisions.
How Are Digital Elevation Models Actually Made?
Creating a Digital Elevation Model is a lot more involved than just snapping a picture from the sky. It's less like photography and more like a high-tech survey, where millions of individual measurements are collected and then pieced together to build a continuous 3D map of the ground.
The methods for building these models are quite different, each with its own trade-offs in terms of cost, effort, and the level of detail they can capture. Every technique has its strengths, making one better for mapping a continent and another ideal for a detailed engineering survey. Ultimately, the technology you choose will define the accuracy and resolution of the final model.
The Art of Photogrammetry
One of the most established methods is photogrammetry. It’s a clever process. You start by taking thousands of overlapping photos from a drone or an aeroplane. Specialised software then gets to work, finding common points across all those images and using them to calculate 3D positions. When you stitch millions of these points together, you get a detailed 3D model of the terrain and everything on it.
This approach is fairly common and often more budget-friendly, making it a great option for creating detailed surface models for specific project sites. The main catch, though, is that it can only map what the camera sees. If dense trees or buildings are covering the ground, it becomes much harder to create a true 'bare-earth' DEM without a lot of extra work to digitally remove those features.
Photogrammetry is all about turning a collection of 2D images into a measurable 3D space. It’s fantastic for creating visually rich models but can fall short when you need to know the precise ground elevation under a thick forest canopy.
Pinpoint Accuracy with LiDAR Scanning
When a project absolutely demands centimetre-level accuracy, Light Detection and Ranging (LiDAR) is the tool for the job. Imagine a sensor firing out millions of laser pulses every second. By timing how long it takes for each pulse to hit a surface and reflect back, a LiDAR system can calculate distances with incredible precision.
When you mount a LiDAR scanner on a drone or aircraft, it paints the landscape with these laser points, creating a super-dense 'point cloud'. The real magic of LiDAR is its ability to see through vegetation. While some laser pulses will bounce off the top of the tree canopy, others will sneak through the gaps and hit the forest floor. This allows us to filter out the trees and buildings to produce a highly accurate DEM of the bare earth, even in the most overgrown areas.
This makes LiDAR the go-to method for:
- Forestry Management: Getting an accurate map of the ground beneath the trees.
- Flood Modelling: Building precise terrain models to predict how water will flow.
- Infrastructure Corridors: Surveying land for new powerlines or pipelines where vegetation gets in the way.
The Big Picture: Satellite Radar and InSAR
For mapping enormous areas—we’re talking entire countries or continents—satellites are the only practical option. A particularly powerful technique they use is Interferometric Synthetic Aperture Radar (InSAR). This method uses radar signals, which have the advantage of working day or night and being able to see right through clouds.
By comparing two radar images taken from slightly different viewpoints in orbit, InSAR can calculate the elevation changes across the surface. The resolution isn't as fine as what you'd get from a drone with LiDAR—often around 30 metres per pixel—but it’s an incredibly efficient way to build the global DEMs that power tools like Google Earth or support large-scale environmental monitoring.
Understanding DEM, DSM, and DTM Differences
When you dive into the world of geospatial data, you'll quickly run into a whole alphabet of acronyms. While a Digital Elevation Model (DEM) is the general term for any 3D map of a surface, it's crucial to understand two specific types: the Digital Surface Model (DSM) and the Digital Terrain Model (DTM). Picking the right one is fundamental for getting your analysis right.
Think of a DSM as the first impression of the landscape from above. It captures the elevation of everything the sensor can see—the tops of buildings, the canopy of a forest, powerlines, and any other structure standing on the ground. It’s the full picture, warts and all.
A DTM, however, is what you’re left with after you digitally strip away all those surface features. It represents the ‘bare earth’—the true contours of the ground itself. Both are technically types of DEMs, but they serve very different purposes.
What’s Actually in Each Model?
The key distinction is simple: what gets included in the final map?
A DSM is all-inclusive, mapping both natural features and man-made structures. This makes it perfect for jobs where the height of these objects is critical, like analysing sightlines for a communications tower or modelling the shadows cast by a new skyscraper.
On the other hand, a DTM is created by carefully filtering out all the non-ground points from the raw data, a process often done with high-precision LiDAR. This gives you a clear view of the underlying topography. Civil engineers rely on DTMs for calculating earthworks (cut-and-fill volumes), and hydrologists use them to predict how water will flow across a landscape without being incorrectly diverted by buildings in the model.
A simple way to keep them straight: A Surface Model includes everything on the surface. A Terrain Model shows only the terrain itself.
The process of creating these detailed models starts with high-quality data collection. The infographic below shows some of the primary methods used to gather the initial elevation data.
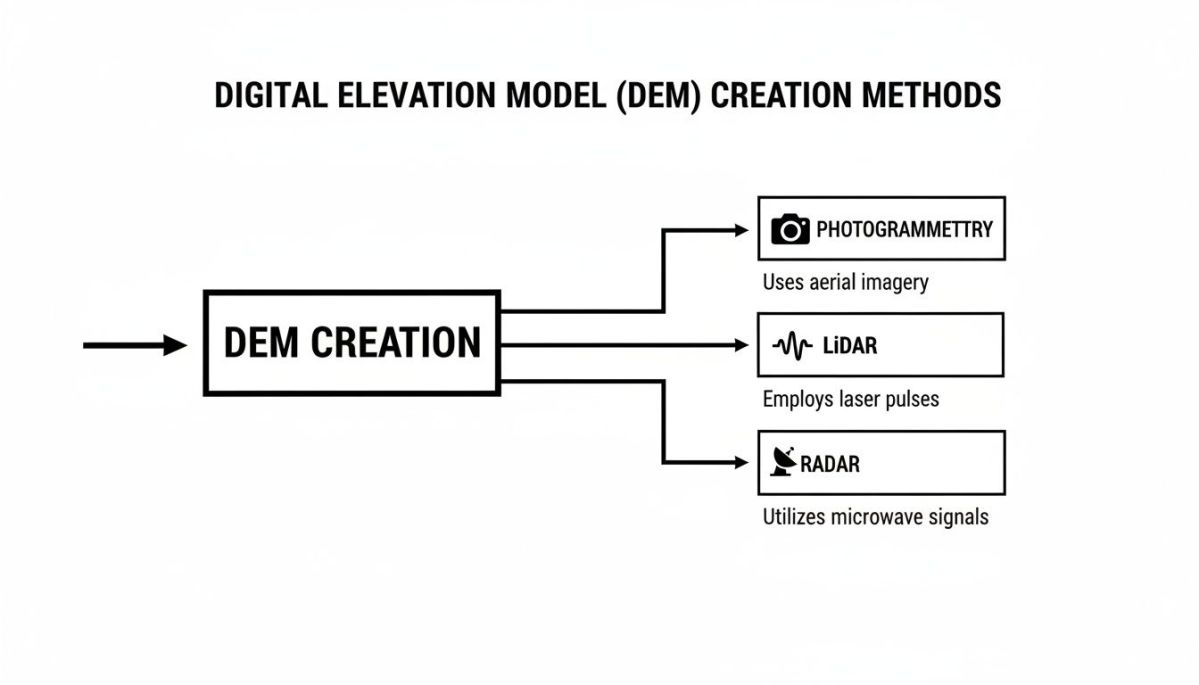
Whether using photogrammetry, LiDAR, or radar, each technique generates a dense point cloud. This rich dataset is the raw ingredient from which we can then process and derive a DEM, DSM, or DTM.
To make the differences even clearer, here's a side-by-side comparison.
Comparing DEM vs DSM vs DTM
| Model Type | What It Represents | Includes Buildings & Vegetation? | Common Use Case |
|---|---|---|---|
| DEM | A general term for any 3D representation of a surface. | Depends on the specific type (DSM or DTM). | Broad-scale elevation mapping, general analysis. |
| DSM | The elevation of the ground plus all features on it. | Yes, it includes everything visible from above. | Urban planning, line-of-sight analysis, forestry. |
| DTM | The elevation of the bare ground only. | No, all surface features are filtered out. | Hydrology, civil engineering, geological surveys. |
Essentially, your choice comes down to the question you need to answer.
Choosing the Right Model for the Job
So, which one do you need? It all depends on your project's goals.
If you’re a utility company assessing how close trees are growing to powerlines, a DSM is your best friend. It shows you the precise height and location of the vegetation relative to your infrastructure.
But if you're planning a new highway or analysing landslide risk, you absolutely need a DTM. Using a DSM here would lead to wildly inaccurate slope calculations based on the tops of trees instead of the actual ground.
In fact, you can even subtract a DTM from a DSM of the same area. The result is a normalised model (often called an nDSM or Canopy Height Model) that shows only the height of the features themselves—a massively useful tool for forestry management and urban planning.
Real-World Uses for Digital Elevation Models
So, what's the big deal with these 3D maps? Beyond the technical jargon, the real value of a Digital Elevation Model is what you can do with it. These detailed surface maps are indispensable tools that solve tangible problems across a whole host of industries—from farming and construction to environmental management and city planning.
A DEM gives you a precise understanding of the land's shape, which is fundamental for making smarter, safer, and more cost-effective decisions. It’s the difference between guessing and knowing. This data turns abstract numbers into real intelligence, helping us design safer roads, protect communities from floods, and so much more. Think of it as the foundational layer for countless modern projects.
Optimising Agriculture and Natural Resources
In farming, efficiency is everything. Farmers use DEMs to get a clear picture of the subtle slopes and dips in their fields. This allows them to implement precision irrigation, ensuring water goes exactly where it's needed without wasteful runoff. For massive operations, like those in the Murray-Darling Basin, this kind of optimisation can be the deciding factor between a bumper crop and a failed one.
DEMs are also a game-changer for forestry and environmental management. By mapping the bare-earth terrain, conservationists can get a much clearer picture of the landscape. This allows them to:
- Model soil erosion: Pinpoint areas prone to soil loss and put measures in place to stop it.
- Analyse wildlife habitats: Understand how the lay of the land affects animal movement and where certain plants will thrive.
- Manage water resources: Accurately map catchment areas and predict how water will flow into rivers and dams.
This level of detail helps ensure we're managing our natural resources responsibly, protecting fragile ecosystems for generations to come.
Engineering Safer Infrastructure
When you’re building the world around us, there’s no room for error. Civil engineers lean heavily on DEMs throughout the entire lifecycle of a project. Before any construction starts, a DEM helps planners find the best routes for new roads, railways, and pipelines, steering clear of dangerously steep slopes or unstable ground.
Take building a highway through hilly country, for example. A DEM lets engineers calculate the exact amount of earth that needs to be moved—a process known as cut-and-fill analysis. This doesn't just save a huge amount of time and money; it also shrinks the project's environmental impact. In the real world, Digital Elevation Models (DEMs) play a crucial role in diverse applications, from environmental modelling to urban planning, including critical uses such as monitoring progress on drone photography for construction sites.
A DEM provides the non-negotiable ground truth for any major construction project. It removes the guesswork from earthworks, drainage design, and route planning, leading to safer and more resilient infrastructure.
Enhancing Urban Planning and Disaster Response
In our cities and towns, knowing the topography is vital for smart development and keeping people safe. Urban planners use DEMs to see how a new development might affect its surroundings, from checking sightlines to modelling how a tall building will cast shadows. This data helps create communities that are more liveable and thoughtfully designed.
But perhaps the most critical application is in flood modelling. By creating an incredibly accurate model of the terrain, emergency services can run flood simulations with stunning precision. For coastal cities threatened by storm surges or towns along rivers, these models are invaluable. They help authorities pinpoint at-risk homes, map out effective evacuation routes, and build flood defences where they'll do the most good—ultimately saving lives and protecting property.
Achieving Pinpoint Accuracy with Modern LiDAR and UAS
While traditional methods give you a decent big-picture view of the terrain, many of today’s projects need much, much more detail. When you’re talking about centimetre-level precision, old satellite data just won't do the job. This is where the powerful team-up of Uncrewed Aerial Systems (UAS) and advanced LiDAR technology really shines.
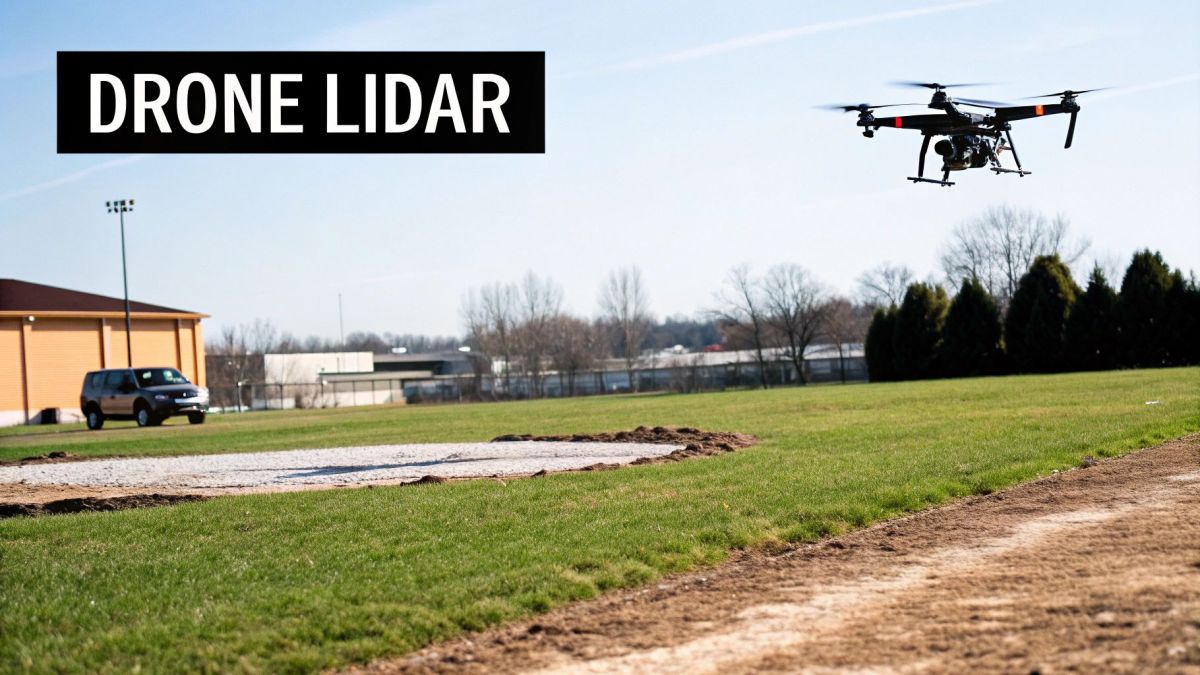
Drones kitted out with high-grade LiDAR scanners can produce incredibly high-resolution Digital Elevation Models with impressive speed. Because they fly closer to the ground and fire off millions of laser pulses every second, these systems capture a stunningly dense point cloud. The result is a map of the terrain with an accuracy that would have been unthinkable just a short while ago.
The UAS and LiDAR Advantage
This combination is a genuine game-changer for any project where small details have big consequences. The data collected is so fine that it can pick up on subtle but crucial topographical features that would be completely missed by lower-resolution models.
This level of precision is absolutely critical for applications like:
- Detailed Engineering Surveys where every centimetre can impact design and safety.
- Construction Site Management for keeping a close eye on progress and accurately calculating earthwork volumes.
- Critical Environmental Monitoring to track slight changes in landforms or coastal erosion over time.
You can see this shift toward higher resolution in national datasets. The 5 Metre Grid DEM of Australia, put together from countless LiDAR surveys, provides far more detail than the older 30-metre satellite models, especially in populated areas. This improved accuracy is vital for managing Australia's coastal zones, where 85% of the population lives. You can dig deeper into how this data was gathered and its use in initiatives like the 2011 Audit of High Resolution Coastal Elevation Data for Australia.
By using specialised UAS and LiDAR solutions, organisations can get past generalised models and capture the ground truth. This superior data leads to better analysis, fewer project risks, and ultimately, smarter decisions.
Driving Better Project Outcomes
The real-world benefits of using high-grade equipment are obvious. A purpose-built UAS can carry better sensors, fly for longer, and operate reliably even when conditions are tough. This makes sure the data you collect is not only accurate but also consistent and repeatable. Modern approaches, like using drones mapping site topography with AI, are also becoming central to how we generate and interpret this precise elevation data.
When you invest in quality data collection from the start, you're building a solid foundation for your entire project. It means less chance of costly rework, fewer surprises during construction, and a reliable baseline for monitoring down the track. It's this deep understanding of the landscape that turns a standard project into a precisely executed, successful one.
Common Questions About Digital Elevation Models
As you start wrapping your head around what a digital elevation model is, a few practical questions always pop up. It’s one thing to understand the concept, but getting to grips with the specifics of accuracy, cost, and file types is what really matters when you put these datasets to work.
Think of this section as a quick FAQ to help you navigate the hands-on side of using DEMs. We'll clear up some of the most common queries we hear, giving you the confidence to choose and use the right data for your job.
What Is the Typical Accuracy of a DEM?
That’s a bit like asking "how long is a piece of string?" The accuracy of a Digital Elevation Model can vary wildly, and it all comes down to how the data was captured in the first place. The right level of accuracy really just depends on the task at hand.
For instance, global satellite-based models like the SRTM dataset might have a resolution of 30 metres and a vertical error of several metres. This is perfectly fine for broad-scale environmental modelling or regional mapping. But if you’re planning a detailed construction survey or designing a new road, you’ll need something far more precise.
On the other end of the spectrum, a modern DEM generated with a drone-mounted LiDAR sensor can achieve incredible vertical accuracy—often down to just a few centimetres. That’s the kind of precision you need for projects where every millimetre counts.
Can You Get a DEM for Free?
You certainly can. Plenty of government agencies, like Geoscience Australia and the United States Geological Survey (USGS), offer free, open-source DEMs for anyone to use. These are fantastic resources for study, large-scale analysis, or just getting a feel for a project area.
But there’s a catch. These free datasets usually don't have the high resolution and pinpoint accuracy needed for most commercial, engineering, or detailed scientific work. For those jobs, you’ll almost always need custom data captured with technologies like aerial LiDAR or drone photogrammetry to meet project standards.
What File Formats Are DEMs Stored In?
DEMs are a type of raster data. At its core, that just means the data is a grid of pixels, where every single pixel holds a specific elevation value. This grid structure lends itself to a few common file formats designed to handle geographic data.
You'll most often come across these formats:
- GeoTIFF (.tif or .tiff): This is the undisputed industry standard. It’s a brilliant format because it packs all the geographic referencing data into a standard TIFF image file, so it plays nicely with virtually all GIS software.
- Esri Grid: This is a proprietary format you’ll see if you work within the Esri ArcGIS ecosystem. It's powerful for analysis but not as easily shared as a GeoTIFF.
- ASCII Grid (.asc): A simple, text-based format. It's easy for humans to read and simple to share, but the files can get very large.
- USGS DEM (.dem): A specialised format developed by the USGS specifically for their own elevation data.
Ultimately, the best format often just depends on the software you're using. Programs like QGIS and ArcGIS are built to chew through these raster files, letting you visualise and analyse the elevation data locked inside that grid of pixels.
For projects that demand centimetre-level accuracy, having the right gear isn't a luxury—it's a necessity. Innoflight International provides advanced UAS and LiDAR solutions that generate the high-precision DEMs needed for critical infrastructure, resource management, and detailed surveying. See for yourself how our systems can deliver the ground truth for your next project.