Ever wondered what point cloud data really is? At its core, it’s a huge collection of tiny individual points, each one plotted out in three-dimensional space. Every single point has its own set of X, Y, and Z coordinates, and when you put millions (or even billions) of them together, they form an incredibly detailed and measurable digital copy of a real-world object, building, or even an entire landscape.
The Foundation of a Digital Twin

A good way to picture it is to think of building a sandcastle. But instead of using actual sand, you’re creating a digital version, one grain at a time. Each tiny grain is a single data point. When you combine millions of these grains, you can precisely map out every tower, wall, and detail of the castle. That "digital sandcastle" is essentially what a point cloud is—a dense, dot-based model of a physical asset.
This cloud of points is the raw material used to create what we call a digital twin. It's far more than just a flat photo or a video. It's a geometrically precise dataset you can move through, measure, and analyse from any perspective. Since every point has a fixed position in space, you can calculate exact distances, areas, and volumes straight from the data itself.
More Than Just XYZ Coordinates
While the X, Y, and Z coordinates tell you where each point is, modern point clouds carry much more information. These extra details add layers of context that turn a simple cluster of dots into a seriously powerful tool for analysis.
To get a clearer picture of what a point cloud is made of, let's break down its key components.
Point Cloud Data At a Glance
| Component | What It Is | Why It Matters |
|---|---|---|
| XYZ Coordinates | The point's exact location in 3D space. | This is the absolute foundation, providing the geometric shape and structure of the scanned object or area. |
| Colour (RGB) | Red, green, and blue values from photos taken during the scan. | It adds photorealistic texture and colour, making the model instantly recognisable and easier to interpret visually. |
| Intensity | The strength of the laser pulse return that captured the point. | This helps distinguish between different materials. A shiny surface will have a higher intensity than a dull one. |
| Classification | A label assigned to a point (e.g., 'ground', 'vegetation', 'building'). | This lets you filter the data, so you can isolate just the ground or remove all the trees to see the structures behind them. |
With these extra layers of information, the point cloud becomes a smart, structured model of reality, not just a bunch of dots.
Why Point Clouds Are So Important
The real power of point cloud data lies in its incredible accuracy and detail. Think about traditional surveying methods—tape measures, manual note-taking—they’re slow and can easily lead to human error. In contrast, laser scanners capture millions of data points every second, often with millimetre-level precision.
This level of accuracy means the digital model is a true reflection of the "as-built" condition of a site, not just a clean version from a design drawing. This is a game-changer for any renovation, inspection, or maintenance project, where the small differences between the design and reality can cause massive budget blowouts and delays.
How We Create Point Cloud Data
So, how do we get from a physical object—like a building, a stretch of coastline, or a paddock—to a detailed digital 3D model? It all comes down to capturing millions of tiny measurements from the real world. Think of it as digital sculpting, but instead of clay, we're using data points.
Two main techniques dominate this space: LiDAR and Photogrammetry. Each has its own way of "seeing" the world, and knowing the difference is crucial for picking the right tool for the job. One is like a bat using sonar, and the other is more like our own two eyes piecing together a scene. Let's break them down.
LiDAR: Scanning with Lasers
LiDAR stands for Light Detection and Ranging. It’s an active scanning method, which means it sends out its own energy to get a reading.
The easiest way to picture it is to think of a bat navigating in the dark. A bat sends out a sound wave, it hits an insect, and the echo tells the bat exactly where its dinner is. LiDAR does the same thing, but with laser light.
A LiDAR sensor, whether it's on a drone, a truck, or a tripod, shoots out hundreds of thousands of laser pulses every second. These pulses zip through the air, hit a surface—a tree branch, the ground, a powerline—and bounce right back to the sensor. The system clocks the exact time it took for that round trip. Since we know the speed of light, a simple calculation gives us the precise distance to that point.
Repeat that process millions of times in every direction, and you get an incredibly dense and accurate cluster of points. That’s your point cloud.
The real magic of LiDAR is its knack for seeing through vegetation. While some laser pulses hit the top of a tree canopy, others will sneak through the gaps to map the actual ground beneath. This makes it the go-to choice for creating accurate terrain models in bushy or forested areas.
Here in Australia, LiDAR is a cornerstone of modern surveying and planning. Point cloud data, mostly from LiDAR, has become a vital national resource. The NSW Foundation Spatial Data Framework, for example, is built on massive airborne LiDAR surveys that capture billions of points to help with everything from flood modelling to urban development. You can actually explore the extensive datasets used in government projects to see just how powerful this is.
Photogrammetry: Building from Pictures
The second heavy hitter, Photogrammetry, works completely differently. It’s a passive method, meaning it doesn't send out any energy. Instead, it uses a standard digital camera to take lots of high-resolution, overlapping photos of an area from every conceivable angle.
Think about how your own vision works. Your two eyes see slightly different versions of the same scene, and your brain merges them to give you a sense of depth. Photogrammetry scales that idea up massively.
Specialised software crunches hundreds or even thousands of these photos, looking for common points across the different images. Using some pretty clever algorithms, it triangulates the position of each of those points in 3D space. Once it has done this for all the common points, it stitches them together to build a dense point cloud.
A big plus here is colour. Since the source is a regular photo, every single point in the cloud has its natural RGB colour data attached, resulting in a model that looks incredibly realistic.
The fact that high-quality cameras are everywhere—especially on drones (UAS)—has made photogrammetry a hugely popular and affordable way to create detailed 3D models. It's perfect for jobs where the visual texture and detail are just as critical as the geometric shape.
Comparing LiDAR and Photogrammetry
Choosing between LiDAR and photogrammetry really depends on what you need to achieve. One isn't better than the other; they're just different tools for different jobs. LiDAR often wins on raw accuracy and its ability to map the ground through trees, while photogrammetry is fantastic for creating visually rich, full-colour models quickly and cost-effectively.
Here’s a simple breakdown of their key differences:
| Attribute | LiDAR | Photogrammetry |
|---|---|---|
| Method | Active (emits laser pulses) | Passive (uses ambient light) |
| Accuracy | Very high, especially for terrain | Good, but can be affected by light/texture |
| Vegetation | Excellent at penetrating canopy | Struggles to map ground under trees |
| Cost | Higher initial equipment cost | Lower cost, uses standard cameras |
| Data Output | Purely geometric point cloud | Point cloud with rich colour (RGB) data |
| Speed | Extremely fast data capture | Slower processing time for images |
| Best For | Forestry, terrain mapping, corridor surveys | Visual inspections, 3D modelling, agriculture |
Ultimately, the project's budget, the required level of detail, and the site conditions will steer you towards the right technology. Sometimes, the best results even come from combining data from both.
The Point Cloud Processing Workflow
Think of a raw point cloud like a giant jigsaw puzzle, with all the pieces dumped on a table. All the information is there, but it's a chaotic jumble without any structure or meaning. The point cloud processing workflow is the step-by-step process of sorting, connecting, and assembling those pieces into a clear, coherent, and incredibly useful 3D picture.
This workflow is what turns that raw data from a digital mess into an accurate and clean dataset ready for real-world analysis. Each stage builds on the one before it, refining the data until it becomes a powerful tool for making informed decisions.
This diagram shows how data flows from its initial capture—whether by camera or laser—into a raw point cloud, which is the starting line for the entire processing journey.
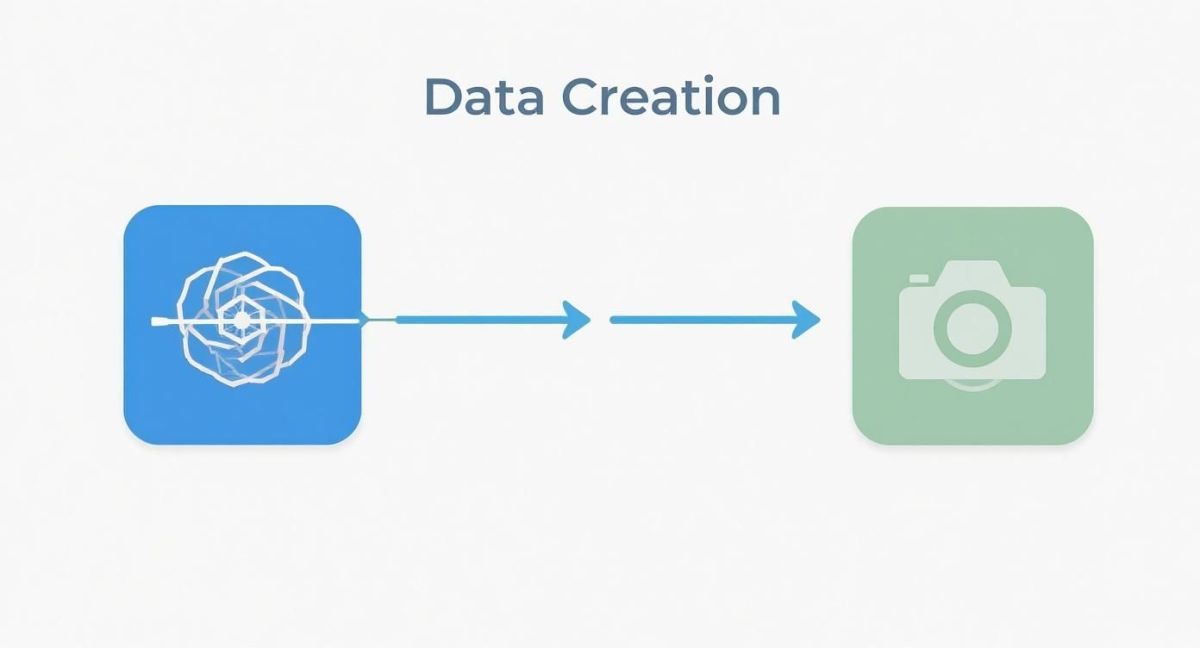
No matter how you capture it, the output is always a raw dataset. Let's walk through the essential stages that transform it into something truly valuable.
Stage 1: Registration
It’s almost impossible to scan a large site or a complex building in one go. Instead, surveyors capture the scene from multiple positions and angles, creating a collection of individual scans. Registration is the first critical task: digitally "stitching" these separate scans together.
It's a lot like creating a panoramic photo on your phone. The software intelligently finds common features or overlapping points across the different scans and uses them as anchor points. It then perfectly aligns every scan into a single, unified coordinate system, creating one seamless point cloud of the entire area.
Getting the registration right is the foundation of a trustworthy 3D model. Even the tiniest misalignment can create a domino effect, leading to major measurement errors across the project. This step locks in the geometric integrity of the whole dataset.
Stage 2: Cleaning and Filtering
Raw point cloud data is never perfectly clean. It’s often contaminated with "noise"—points that don't belong to the permanent environment. This could be anything from a car driving past during the scan, a bird flying through the laser's path, or even dust particles hanging in the air.
This is where cleaning and filtering come in. It’s a digital clean-up job. Sophisticated algorithms can automatically find and delete these outliers and any other rogue data points. This ensures you’re left with a clean dataset that accurately represents the real-world conditions of the site.
Stage 3: Classification
With the point cloud registered and cleaned, the next step is to give it some intelligence. Classification is the process of teaching the software to recognise and categorise different types of objects within the sea of points.
Essentially, powerful algorithms analyse clusters of points based on their shape, intensity, and location relative to each other. This allows the software to automatically assign labels to them, sorting them into distinct categories.
Common classifications include:
- Ground: Identifying the bare earth.
- Vegetation: Separating trees, bushes, and crops.
- Buildings: Grouping all points that make up structures.
- Powerlines: Isolating utility wires and poles.
- Water: Defining the surface of rivers, lakes, and dams.
This automated labelling is a massive time-saver. An engineer can instantly hide all the buildings and vegetation to see just the ground terrain for creating an elevation model. For an agricultural specialist using a survey drone like those from Innoflight International, it means they can easily separate the crop canopy from the soil to analyse plant health.
Stage 4: Meshing and Modelling
For many projects, the final step is to transform the organised cloud of points into a solid, usable 3D model. A classified point cloud is fantastic for taking measurements, but it’s still just a collection of individual dots. Meshing is the process that connects those dots.
The software generates a web of tiny triangles that link adjacent points, effectively creating a digital "skin" over the point cloud. This turns the sparse collection of points into a solid 3D object with surfaces, volume, and texture. The result is a high-fidelity model ready to be used in CAD software, virtual simulations, or for creating stunningly realistic visualisations.
Let's be honest, one of the biggest headaches with point cloud data isn't capturing or processing it—it's the sheer size of the files. A single, detailed scan of a building or a stretch of highway can easily balloon into terabytes of data. Your standard office computer just isn't cut out for that kind of heavy lifting.
These enormous datasets demand a whole new way of thinking about storage and management. Trying to open, move, or analyse a terabyte-sized file on a local hard drive is a recipe for frustration. This is where cloud computing has really stepped in, giving us the muscle and flexibility we need to get the job done.
Moving Beyond the Local Hard Drive
Cloud platforms solve two of the biggest problems we face with point cloud data: storage that never runs out and computing power on tap.
-
Scalable Storage: Instead of constantly buying and managing new physical servers, cloud storage lets you expand your capacity whenever you need it. As your project grows from gigabytes to terabytes, the storage just grows with you. No fuss.
-
High-Performance Computing: Cloud services give you access to incredible computational power. This means you can run complex tasks—like registering multiple scans or classifying points—on powerful virtual machines. A job that might take days on a desktop can be done in just a few hours.
The Role of Cloud Providers in Australia
Major cloud providers have set up serious infrastructure here in Australia, which is a huge benefit for local industries like mining, construction, and agriculture. These sectors depend on having fast, reliable access to their spatial data, and local data centres make that possible.
The growth in this space is massive. The Australian public cloud market, which is the engine room for processing and storing point cloud data, is currently worth around USD 23.96 billion. It's expected to explode to USD 150.97 billion by 2033, and that growth is being fuelled by industries that rely on these huge 3D datasets. If you want to dive deeper into the numbers, you can explore the full market analysis on imarcgroup.com.
A smart strategy many Australian firms are using is the hybrid cloud model. It's the best of both worlds—you keep sensitive data secure on your own private servers but use the public cloud for the heavy-duty processing and collaboration. In fact, about 70% of Australian infrastructure decision-makers are already using a hybrid setup.
Protecting Your Valuable Data Assets
When you're dealing with datasets this valuable, protecting them is non-negotiable. A single corrupted file or a security breach could mean thousands of dollars in lost work and massive project delays. This is why having a rock-solid backup and disaster recovery plan isn't just a good idea—it's essential.
To keep your point cloud archives safe and sound, you need to implement immutable backup solutions. Think of an immutable backup as a "write-once, read-many" copy of your data. Once it's created, it can't be changed or deleted by anyone, which is your best defence against ransomware, accidental deletion, or corruption. It creates a secure, unchangeable record of your project, ensuring your data is safe for years to come.
Real-World Applications of Point Cloud Data

The theory behind what is point cloud data is interesting, but its real power shines when you see it applied in the real world. Across Australia, this technology is solving tangible, expensive problems for a huge range of industries, delivering a level of precision that was simply out of reach before.
From bustling construction sites in Sydney to vast agricultural properties in rural Queensland, point clouds provide a rock-solid digital foundation for making critical decisions. Let's dig into a few of the key sectors where this data is making a real difference.
Construction and Engineering
In construction, the gap between the original design and the "as-built" reality can cause massive budget blowouts and delays. Point cloud data closes that gap. It creates a millimetre-accurate digital replica of a project at any given moment.
This "digital twin" lets teams do some incredible things:
- Verify Accuracy: You can directly compare what’s been built against the design model to catch mistakes early. No more nasty surprises.
- Prevent Clashes: Before installing plumbing or HVAC systems, you can overlay the new designs onto the as-built scan to make sure everything actually fits.
- Monitor Progress: Regular scans allow you to track construction progress against schedules and budgets using objective, measurable data.
This proactive approach dramatically cuts down on rework, which can eat up as much as 15% of total construction costs. Finding problems digitally first saves a fortune in on-site fixes.
By capturing the exact state of a site, point cloud data provides a single source of truth for all stakeholders. It eliminates guesswork and ensures that every decision is based on precise, real-world measurements, not outdated drawings.
Precision Agriculture and Farming
The agricultural sector is also getting a major boost from point cloud technology, often captured with specialised drones. Farmers can generate incredibly detailed 3D maps of their properties, giving them crucial insights into both their crops and the land itself.
For example, a point cloud can show subtle changes in terrain elevation. This helps with planning optimised irrigation and drainage systems that conserve water and prevent soil erosion. Farmers can also analyse crop health by measuring things like canopy height and density, helping them pinpoint underperforming areas and apply fertiliser or water exactly where it's needed.
Mining and Resource Management
In mining, safety and efficiency are everything. Point clouds bring a new level of accuracy to essential tasks that used to be dangerous and slow.
- Stockpile Volumes: Calculating the exact volume of extracted materials is now a quick, simple, and highly accurate job with a 3D scan.
- Pit Surveys: Drones with LiDAR can safely map open-cut pits and tailings dams, providing vital data for stability monitoring and operational planning.
- Infrastructure Integrity: Scanning processing plants and equipment helps maintain a digital record, making maintenance planning and asset management far more effective.
Infrastructure and Asset Inspection
Maintaining Australia’s critical infrastructure—from bridges and railways to powerlines and pipelines—is a monumental task. Point cloud data makes these inspections safer and more thorough. Instead of sending crews into hazardous situations, a drone or a ground-based scanner can capture a complete 3D dataset.
Engineers can then analyse this data from the safety of their office. They can inspect every component for defects, measure how close vegetation is to powerlines, or assess structural integrity with incredible detail. This doesn't just improve safety; it can cut travel costs and site visits by up to 50%.
The growing use of this data is also fuelling a key part of Australia's tech economy. The national AI and data annotation sector, which refines these datasets for machine learning, is projected to exceed $6.6 billion. In fact, over 53% of tech startups now depend on this high-quality 3D data. You can discover more about how data annotation is shaping Australia's tech scene in this article about accelerating innovation in Australia's AI future.
What Are The Common Point Cloud File Formats?
Think of point cloud files like you would a photo or a document. Just as you have .jpg for images and .pdf for documents, point cloud data comes in a few different flavours. Picking the right one isn't just a technical detail; it's a practical decision that affects how you share, process, and store your data.
The biggest fork in the road is between proprietary and open formats. Proprietary files are tied to a specific scanner brand, which can lock you into their ecosystem. On the other hand, open formats are built for collaboration, working across all sorts of different software and making life much easier.
The Industry Go-To: LAS and LAZ
If you're working with LiDAR data, you're going to come across the LAS (.las) format. It’s the undisputed industry standard for good reason. A LAS file doesn’t just store the basic X, Y, and Z coordinates; it packs in a heap of extra information, like colour values, intensity readings, and even classification codes that tell you if a point is ground, a tree, or a building.
And what about LAZ (.laz)? It's simply the compressed version of LAS. You get all the same rich data, just squeezed into a much smaller, more manageable file size. It’s perfect for archiving projects or sending large datasets without losing a single bit of information.
For any serious project that requires deep analysis—like surveying, forestry, or infrastructure inspection—LAS and LAZ are the only way to go. The metadata they carry is the secret sauce that makes professional workflows possible.
Other Formats You'll Encounter
While LAS and LAZ are the big players, especially in the LiDAR world, a few other formats pop up regularly. Each has its own job to do, whether it's for a quick data transfer or for long-term project archiving.
Let's take a look at a summary of the most common file formats you'll run into.
Understanding Common Point Cloud File Formats
| Format | Description | Best For |
|---|---|---|
| XYZ (.xyz or .txt) | A simple, plain-text format listing X, Y, and Z coordinates per line, sometimes with RGB colour. | Quick data sharing and compatibility with almost any software, but lacks metadata. |
| E57 (.e57) | A vendor-neutral, open format designed as a complete record of a scan project. | Long-term archiving and transferring entire projects, as it bundles point data and 2D images. |
| LAS (.las) | The industry-standard format for terrestrial and airborne LiDAR data. | Storing rich metadata like classification, intensity, and GPS time for detailed analysis. |
| LAZ (.laz) | The compressed, lossless version of the LAS format. | Storing and transferring large LAS datasets efficiently without any data loss. |
Knowing these formats helps you make smarter decisions about how to manage your data from capture all the way through to the final deliverable. Choosing the right file type from the start can save you a lot of headaches down the line.
A Few Common Questions About Point Cloud Data
To wrap things up, let's go through a few of the questions that pop up all the time. Getting these straight will really help solidify your understanding of how this technology works in the real world.
What’s the Difference Between a Point Cloud and a 3D Model?
It’s easy to get these two mixed up, but the distinction is pretty simple. Think of a point cloud as the raw ingredient list. It’s a massive, unorganised collection of millions of individual data points, each one with its own precise X, Y, and Z coordinates. It's the skeleton, the direct digital measurement of an object or space.
A 3D model, on the other hand, is the finished meal. It’s what you create from the point cloud. Specialised software connects all those individual dots with a mesh (usually made of tiny triangles) to create solid surfaces, add textures, and give it a recognisable shape. The point cloud is the measurement; the 3D model is the interpretation.
Just How Accurate Is Point Cloud Data?
This is a classic "it depends" situation. The accuracy of your point cloud comes down entirely to the tool you used to capture it.
- LiDAR is the gold standard for precision. We're often talking about accuracy down to just a few millimetres. That's why it's the go-to for serious engineering, construction, and high-detail land surveying jobs where every millimetre counts.
- Photogrammetry can also deliver fantastic results, typically getting you within a few centimetres of reality. The final accuracy is shaped by things like the quality of your camera, how good the lighting is, and making sure you have plenty of overlapping photos.
Ultimately, the right tool is always dictated by how much precision your project actually needs.
In short, a point cloud is the direct, unfiltered digital measurement of reality. A 3D model is the visual interpretation of that data, turning millions of dots into a coherent, solid object that's easier for us to work with and understand.
Is Point Cloud Data Hard to Work With?
It used to be, but things have gotten much easier. Yes, the datasets are enormous, and you'll definitely need a decent computer and the right software to handle them. But let's be clear: working with point clouds is more accessible today than it has ever been.
Modern software has taken a lot of the headache out of the process, automating complex steps like registering multiple scans together and cleaning up noisy data. The biggest hurdles now are usually managing the huge file sizes and getting your head around a new software workflow. With cloud computing becoming mainstream and software interfaces getting more intuitive, this tech is no longer just for a handful of specialists.
Ready to see how high-precision drone solutions can transform your operations? Innoflight International provides advanced UAS platforms for LiDAR mapping, agricultural surveys, and critical infrastructure inspections.
Discover the right drone for your project at evolutionflight.com