At its heart, aerial photogrammetry is the science of making measurements from photographs. More specifically, it’s about taking a series of overlapping photos from a drone or aircraft and stitching them together to create incredibly accurate digital maps and 3D models.
It’s how we turn hundreds of individual pictures into one single, coherent, and measurable digital version of a real-world place.
From Photos in the Sky to Models on Your Screen
Think about how your eyes work. You have two of them, and because they see the world from slightly different positions, your brain can perceive depth. Aerial photogrammetry uses the exact same principle, just on a much grander scale.
A drone flies a carefully planned, automated grid pattern over a site, snapping high-resolution photos along the way. The key is that each photo significantly overlaps with the ones next to it, so every feature on the ground is captured from multiple angles. This overlap is what makes the magic happen.
Back in the office, specialised software gets to work. It meticulously analyses all the images, finds thousands of common tie-points between them, and uses some pretty complex triangulation maths to calculate the precise 3D position of each of those points. The final output isn't just a picture—it's a dense, data-rich digital model you can explore, measure, and analyse from any angle.
The Foundation of Modern Mapping
While drones have made this technology more accessible than ever, the idea of using photos from the sky for mapping is nothing new. Australia, in particular, has a rich history here. Geoscience Australia actually holds a national archive of over 1.2 million historical aerial photos, with some dating all the way back to 1928. It's a fascinating look at how we've been using this technique to understand and build our country for nearly a century.
This long legacy shows just how powerful a bird's-eye view can be. Today, photogrammetry is a core part of a much bigger field. To see how all this spatial data fits together, it's worth taking a moment to learn about the field of geomatics and how it shapes our world.
By stitching together countless individual perspectives, aerial photogrammetry creates a cohesive digital twin of reality. It moves beyond simple photography to become a powerful tool for measurement and analysis.
What Makes It All Work?
So, how do we get from a folder of JPEGs to a survey-grade 3D model? It comes down to a few key ingredients working in harmony. It’s not about just creating a pretty picture; it’s about generating geographically accurate data where every single pixel has a real-world coordinate tied to it.
Here’s a quick rundown of what’s involved.
Core Components of Aerial Photogrammetry
This table provides a quick summary of the essential elements involved in the aerial photogrammetry process.
| Component | Role and Purpose |
|---|---|
| Aerial Platform & Sensor | Usually a drone (UAS) carrying a high-resolution camera. This is your eye in the sky. |
| Mission Plan | A pre-programmed flight path that dictates altitude, speed, and image overlap (front and side). |
| Ground Control Points (GCPs) | Marked points on the ground with precisely known coordinates, used to anchor the model to the Earth. |
| Processing Software | Powerful programs like Pix4D or Agisoft Metashape that do the heavy lifting of aligning images and building the final models. |
Once you get your head around these basic elements, it's easy to see how a simple set of photos can become the bedrock for projects in everything from construction and mining to environmental monitoring and agriculture.
How Drone Photos Become Accurate 3D Data
So, how do we get from a folder full of flat, two-dimensional drone photos to a detailed 3D model you can actually measure? It’s a fascinating process that, in a way, mimics how our own eyes see the world, but with a whole lot more mathematical muscle behind it. The end result isn't just a pretty picture; it's a digital twin of a real-world place.
The magic at the heart of it all is a principle called stereoscopy. Think back to those old View-Master toys. You'd look through the viewer, and each eye would see a slightly different image. Your brain would then fuse those two images together to create a sense of depth. Photogrammetry software does something very similar, just on a massive scale. It analyses photos of the same object on the ground, captured from dozens of different angles by the drone.
By finding common points across all those overlapping images, the software uses triangulation to calculate the precise X, Y, and Z coordinates for millions of individual points. This is how the flat images get their 3D structure.
The Critical Role of Image Overlap
For this to work, the software needs to see the same feature in multiple photos. You can’t have any blind spots. That’s why setting the right amount of image overlap in the drone's flight plan is non-negotiable.
- Forward Overlap (Endlap): This is the overlap from one photo to the next along the drone’s flight path. We typically aim for 70-80% to ensure a strong, continuous link between images.
- Side Overlap (Sidelap): This covers the overlap between adjacent flight lines. A setting of 60-70% is standard practice here, making sure the entire area is stitched together seamlessly.
Skimp on overlap, and you’ll get holes or strange distortions in your final map. It's the digital glue holding the entire model together.
Anchoring the Model to the Real World
While overlap gives our model its shape, it doesn't tell us where it is on the planet. To give it real-world geographical accuracy, we need to anchor it using Ground Control Points (GCPs).
Think of GCPs as digital thumbtacks. Before the flight, we place these distinct markers on the ground across the survey area and measure their exact coordinates with high-precision GPS. When the drone flies over and these markers appear in the photos, we can tell the software, "This exact pixel is located at these precise coordinates." This allows it to perfectly align, scale, and orient the entire model.
For a deeper dive into how this super-accurate positioning works, our guide explaining what RTK GPS is is a great place to start.
A photogrammetry model without GCPs is like a beautifully drawn map with no compass or scale. It might look correct, but you can’t trust it for reliable measurements because it’s just floating in digital space.
Creating a True-to-Scale Map with Orthorectification
The final piece of the puzzle is a process called orthorectification. A raw aerial photo isn't a true map. Because of the camera's perspective, tall buildings can look like they’re leaning outwards, and hilly ground can stretch or squash distances. For projects that demand high-quality initial imagery, many turn to specialised real estate drone photography services.
Orthorectification is the process that corrects all these distortions. Using the elevation data from the 3D model it just built, the software adjusts every single pixel so it appears as if viewed from directly above. This turns a collection of separate, slightly warped photos into a single, uniform-scale image called an orthomosaic map—a true map where every distance you measure is accurate.
The 4-Stage Aerial Photogrammetry Workflow
Knowing the theory is one thing, but watching a project come to life is where it really clicks. An aerial photogrammetry mission isn’t just about flying a drone; it’s a methodical process with four distinct stages that take you from an idea to a highly valuable dataset.
Let's walk through how a typical project unfolds, step-by-step.
Stage 1: Mission Planning
Long before the drone's propellers start spinning, the most important work is already underway. This is the Mission Planning stage, and it’s all about defining what success looks like for your project. You’ll start by outlining the exact survey area on a map and deciding on the outputs you need, as this will shape every decision that follows.
This is where you'll use specialised software to dial in the key flight parameters. For instance, you'll set:
- Flight Altitude: This directly impacts your Ground Sample Distance (GSD), which is just a fancy way of saying how much ground detail is captured in a single pixel. Lower altitude means more detail.
- Image Overlap: As we covered earlier, getting enough overlap between photos is non-negotiable. A typical setup is 70-80% forward and side overlap to ensure the software has plenty of common points to stitch together.
- Flight Pattern: An automated grid pattern is programmed to guarantee the drone covers every inch of the target area efficiently.
Getting these details right is the foundation for capturing quality data. To see the tools that make this happen, check out our guide on UAV flight planning software.
This infographic gives a great visual breakdown of how all those individual photos eventually become a 3D model.
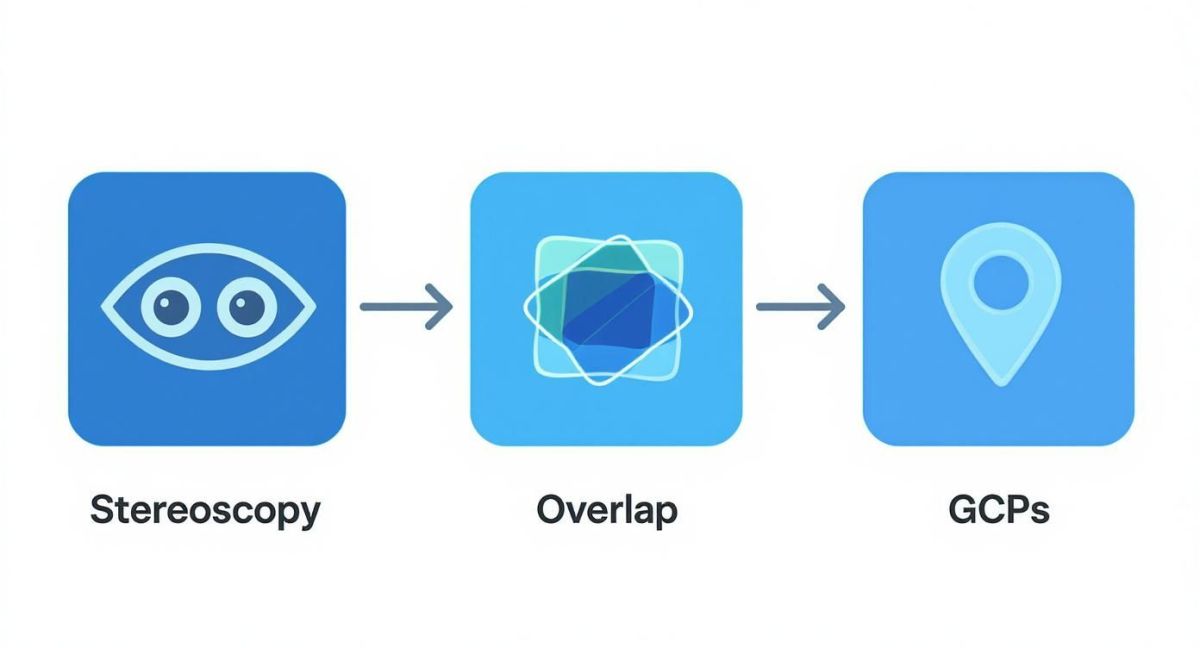
It shows how the core principles—stereoscopy, plenty of image overlap, and Ground Control Points—all work in concert to build a final model that is not only three-dimensional but also tied accurately to its real-world location.
Stage 2: Data Acquisition
With a rock-solid plan in place, it’s time to fly. The Data Acquisition phase is when the drone takes to the skies. A modern UAS will fly the pre-programmed route on its own, snapping high-resolution photos at precisely calculated points along its path.
During the flight, the pilot’s job is one of oversight—monitoring the mission, ensuring flight safety, and keeping an eye on variables like wind or changing light. For projects needing survey-grade accuracy, this is also when Ground Control Points (GCPs) are measured on the ground with survey gear. These GCPs act as high-precision anchors for the entire dataset.
Stage 3: Data Processing
Once the drone is back on the ground, the "photogrammetry" magic really begins. During the Data Processing stage, the hundreds (or thousands) of photos are loaded into powerful processing software like Agisoft Metashape or Pix4Dmapper.
From there, the software does the heavy lifting through a series of complex steps:
- Image Alignment: First, it scans all the images, identifying and matching thousands of common points between them.
- Point Cloud Generation: Using the principles of stereoscopy, it calculates the 3D position of those points, creating a massive "dense point cloud" containing millions of individual points, each with a specific X, Y, and Z coordinate.
- Model Creation: This point cloud becomes the foundation for building the final outputs, like a textured 3D mesh or a Digital Surface Model (DSM).
- Orthomosaic Generation: The software then corrects for distortion and stitches all the original photos together into one giant, geographically accurate image—the orthomosaic.
This number-crunching phase is intense. It can take anywhere from a few hours to a few days, depending on how large the dataset is. Think of it as a digital factory where raw images are transformed into polished geospatial products.
Stage 4: Analysis and Delivery
The final stop is the Analysis and Delivery stage. Now that you have perfectly processed models and maps, you can start pulling out the valuable information you were after. This might mean calculating the exact volume of a stockpile at a mine, analysing crop health patterns across a farm, or creating contour lines for an engineering design.
The final products—whether it’s the orthomosaic, point cloud, or 3D model—are then exported in standard formats for use in CAD or GIS programs and handed over to the client. This is where the data becomes a decision-making tool, turning an accurate picture of a site into actionable intelligence.
What Digital Assets Can You Create?
Once the drone is back on the ground and the processing software has done its thing, what you're left with is far more than just a folder full of photos. The real value of aerial photogrammetry comes from the rich, accurate, and measurable digital assets it creates. These are the final products that give you the insights to make better decisions.
Knowing what these outputs are and how they differ is crucial. Each one serves a specific purpose, turning a simple set of images into a powerful tool for analysis.
Orthomosaic Maps: The True-to-Scale Image
The most common output is the Orthomosaic Map. Think of it as a Google Maps-style view of your site, but with incredibly high resolution and perfect geographical accuracy. It’s built by stitching together hundreds or even thousands of individual photos, correcting for any distortions caused by the camera's angle or the shape of the land.
This correction process, called orthorectification, means the map has a uniform scale across the entire image. This is a game-changer because you can take precise measurements—distances, areas, perimeters—directly from the map itself. That's something you simply can't do with a standard photo. For site planning, tracking progress, or creating as-built records, orthomosaics are absolutely essential.
Digital Models: Representing Surfaces and Terrain
Next, we step into the third dimension with digital elevation models. These aren't pictures in the traditional sense. Instead, they are grid-based datasets where every single cell in the grid holds an elevation value. There are two key types you'll work with.
-
Digital Surface Model (DSM): This model captures the elevation of everything on the surface. That means it includes buildings, trees, vehicles, and stockpiles—anything the drone could see from above. A DSM is exactly what you need for tasks like vegetation management, line-of-sight analysis, or measuring the heights of structures.
-
Digital Terrain Model (DTM): The DTM, on the other hand, represents the bare earth. Specialised software algorithms intelligently strip away all the surface features from the DSM, leaving you with just the ground's topography. Engineers and surveyors depend on DTMs to generate accurate contour maps, design drainage, and calculate cut-and-fill volumes for construction projects.
A simple way to remember the difference: a DSM shows you the tops of the trees in a forest, while a DTM shows you the ground beneath them. Being able to separate the two is fundamental for almost any kind of geospatial analysis.
3D Models: Visualising the Real World
Finally, photogrammetry lets you create stunning, immersive 3D representations of your site. These models are incredible for giving stakeholders, who might not be used to reading 2D plans, a real-world context they can instantly understand.
The raw foundation of any 3D model is the 3D Point Cloud. It's a massive collection of millions—sometimes billions—of individual points, each with its own precise X, Y, and Z coordinate in space. It might look like a fuzzy 3D photo at first glance, but it’s an incredibly accurate dataset you can use for detailed measurements and analysis.
From that point cloud, you can generate a Textured 3D Mesh. This is where the software connects the dots to form a continuous surface made of tiny triangles, then drapes the original high-resolution photos over the top like a skin. The result is a photorealistic, navigable 3D model of your site that you can fly through, inspect from any angle, and use for virtual site visits or powerful project presentations.
The outputs from a photogrammetry survey are diverse, each offering a unique perspective on your project site. Choosing the right one depends entirely on what you need to measure, analyse, or communicate.
Aerial Photogrammetry Outputs Compared
| Output Type | Description | Primary Use Case |
|---|---|---|
| Orthomosaic Map | A high-resolution, distortion-free aerial image of a site with a uniform scale, similar to a detailed satellite map. | Taking accurate 2D measurements (distance, area), progress monitoring, site planning. |
| Digital Surface Model (DSM) | An elevation model that captures the height of all surface features, including buildings, vegetation, and other objects. | Vegetation management, line-of-sight analysis, solar panel placement, 3D building modelling. |
| Digital Terrain Model (DTM) | An elevation model of the bare earth, with all surface features like buildings and trees digitally removed. | Generating contour lines, calculating earthwork volumes (cut/fill), drainage and flood analysis. |
| 3D Point Cloud | A massive dataset of individual points, each with a precise X, Y, and Z coordinate, forming the raw 3D structure of the site. | Detailed measurements, clash detection, as-built verification, foundation for other 3D models. |
| Textured 3D Mesh | A photorealistic 3D model created by connecting the points in a point cloud and overlaying them with high-resolution image textures. | Stakeholder presentations, virtual inspections, marketing materials, urban planning. |
From a simple 2D map to a fully interactive 3D model, these digital assets provide a complete picture of your site, giving you the clarity needed to manage your projects more effectively.
How Industries Use Aerial Photogrammetry
The true power of aerial photogrammetry isn’t measured by its technical jargon, but by the real-world problems it solves. Across Australia, this technology has broken out of its niche as a simple mapping tool. It’s now a core driver of efficiency, safety, and insight for a growing list of industries.
By turning a collection of aerial images into practical, measurable data, businesses are completely rethinking how they manage projects, assets, and natural resources. It’s a fundamental shift from guesswork to informed decisions, with real impacts on the bottom line.
Construction and Earthworks Management
On any construction site, accuracy and efficiency are everything. Site managers are now using weekly or even daily drone flights to generate up-to-the-minute orthomosaic maps and 3D models of their projects. This gives them an undeniable visual record of progress, making it simple to track milestones and keep stakeholders in the loop.
One of the biggest game-changers is stockpile volume calculation. What used to be a slow, often inaccurate manual job can now be done with a quick drone survey, calculating the precise volume of sand, gravel, or soil. This level of accuracy is huge for managing inventory, verifying invoices, and avoiding costly material shortages or overruns.
These models are also invaluable for safety. A project manager can spot potential hazards, check for compliance, and plan site logistics without ever sending someone into a high-risk area of an active work site.
Precision Agriculture and Farming
For today’s farmers, aerial photogrammetry is the key to unlocking the true potential of their land. Drones carrying specialised multispectral sensors capture data far beyond what the human eye can see, creating detailed maps that reveal subtle but critical variations in crop health.
These insights let farmers take targeted action:
- Spotting Stress Zones: They can pinpoint areas hit by irrigation problems, pests, or nutrient deficiencies long before they become visible on the ground.
- Optimising Inputs: Instead of blanket-spraying fertiliser or water, farmers can use the data to apply them only where needed, saving money and reducing environmental runoff.
- Forecasting Yields: By analysing plant health and density throughout the season, they can develop much more accurate predictions for their harvest.
This data-driven approach moves farming from a game of averages to a science of precision, ultimately leading to healthier crops, bigger yields, and more sustainable practices.
Infrastructure and Asset Inspection
Keeping tabs on critical infrastructure like bridges, dams, power lines, and railways is a massive undertaking. Traditionally, it meant shutting down services, putting up expensive scaffolding, or placing inspection crews in genuinely dangerous situations.
Aerial photogrammetry changes that entirely. A drone can capture thousands of high-resolution images of a structure in a fraction of the time, creating a detailed 3D model that engineers can inspect safely from their desks. They can zoom in on individual components, measure cracks with precision, and monitor for wear and tear over time.
This remote inspection method doesn't just improve safety by keeping people out of harm's way; it also slashes downtime and the associated costs, helping to keep our essential services reliable. The detailed 3D models and digital terrain created through aerial photogrammetry are also becoming the foundation for many VR, AR, and MR applications across various industries.
Environmental Monitoring and Land Management
To properly manage our natural landscapes, we need accurate, current information. In Australia, using aerial photography for land management has a long and impressive history. For instance, Western Australia's program, managed by Landgate, has documented 77 years of landscape change since 1948. This incredible, long-term record shows just how vital aerial photogrammetry is for tracking everything from coastal erosion and bushfire recovery to shifts in vegetation and water resources.
From monitoring mine site rehabilitation to managing forestry inventories, the ability to generate precise topographic maps and 3D models helps organisations make better decisions. It provides the clarity needed to balance economic activities with environmental stewardship, which is essential for managing Australia’s vast and varied landscapes.
Your Questions Answered: A Practical Look at Aerial Photogrammetry
As you get to grips with what aerial photogrammetry is, a few practical questions always pop up. It’s a powerful technology, but it’s just as important to understand its real-world capabilities and limitations. Let’s break down some of the most common queries to give you a clearer picture.
Just How Accurate Is It?
This is usually the first question on everyone's mind, and the honest answer is: it depends entirely on how you do it. A basic drone survey, on its own, might produce a model that looks perfect but could be off by several metres when you try to place it on a real-world map. But with the right techniques, the precision can be outstanding.
The secret to achieving survey-grade accuracy—we're talking down to a few centimetres—is using Ground Control Points (GCPs). As we touched on earlier, these are clearly marked targets on the ground with exact, known coordinates. By locking your digital model to these physical anchors, you ensure the final map isn't just the right shape, but it's also perfectly positioned on the globe. For even better results, high-end drones with built-in RTK/PPK systems can deliver incredible precision, making photogrammetry a trusted tool for professional surveyors.
What's the Difference Between Photogrammetry and LiDAR?
Both photogrammetry and LiDAR are fantastic remote sensing tools, but they work in fundamentally different ways. The easiest way to think about it is one is passive and the other is active.
-
Photogrammetry (Passive): This method is all about seeing. A drone's camera captures reflected sunlight, taking thousands of high-resolution photos. Specialised software then stitches these images together to build a 3D model. Because it starts with photos, you get beautifully photorealistic, full-colour results.
-
LiDAR (Active): The name stands for Light Detection and Ranging. A LiDAR sensor doesn’t wait for sunlight; it actively shoots out pulses of laser light and measures the time it takes for them to bounce back. This process directly measures millions of distance points, creating an exceptionally accurate point cloud of the landscape.
The real difference is simple: Photogrammetry uses images to calculate 3D geometry, while LiDAR uses lasers to directly measure it. This means LiDAR is brilliant at piercing through vegetation to map the bare ground beneath, while photogrammetry excels at creating visually rich, textured models of what the eye can see.
What Kind of Drone Do I Actually Need?
You definitely don't need the most expensive drone out there, but your standard hobbyist model won't cut it for professional work. The ideal aircraft is a careful balance of flight stability, camera quality, and positioning tech.
For reliable, high-quality data, you'll want a drone with a few key features:
- A High-Resolution Camera: Look for a sensor that’s at least 20 megapixels, paired with a sharp, quality lens. The more detail you capture in every shot, the better and more accurate your final model will be.
- Rock-Solid Flight Stability: Your drone needs to hold its position steady and fly smooth, automated grid patterns, even when the wind picks up. This ensures you get consistent photos with plenty of overlap.
- RTK/PPK Capability: If you're aiming for survey-grade results, a drone with Real-Time Kinematic (RTK) or Post-Processed Kinematic (PPK) GPS is a game-changer. This tech records the drone's position for every photo with centimetre-level accuracy, which dramatically improves the final map's precision.
How Long Does All the Data Processing Take?
This is the part of the workflow that really tests your patience. There's no single answer here, as the time it takes to process the data can vary wildly. It's less like saving a document and more like rendering a complex 3D movie—it demands some serious computing muscle.
A few key things will influence your processing time:
- The Size of Your Project: A quick, 10-minute flight that nets you 200 photos might be done in a couple of hours. On the other hand, a massive survey with 5,000+ images could easily chew up a full day or more, even on a powerful machine.
- Your Computer's Power: The speed of your computer’s processor (CPU), its amount of RAM, and the power of its graphics card (GPU) are all critical. Better hardware can slash processing times significantly.
- The Quality You Need: Knocking out a quick, low-resolution draft is far faster than generating a super-dense point cloud or a highly detailed textured mesh. The higher you set the quality, the longer the software needs to crunch the numbers.
At the end of the day, you have to let the computer do its work. The software is meticulously calculating the 3D position of millions of individual points, and giving it the time it needs is the only way to get a great result.
Understanding these practical details helps you see how aerial photogrammetry goes from a cool concept to a powerful tool you can use in the real world. With the right gear and a solid workflow, you can create digital models that offer incredible insights for almost any industry.
At Innoflight International, we specialise in providing the advanced UAS solutions needed to capture high-accuracy data efficiently and reliably. To find the perfect drone and sensor package for your specific project needs, explore our systems today.